DevOps
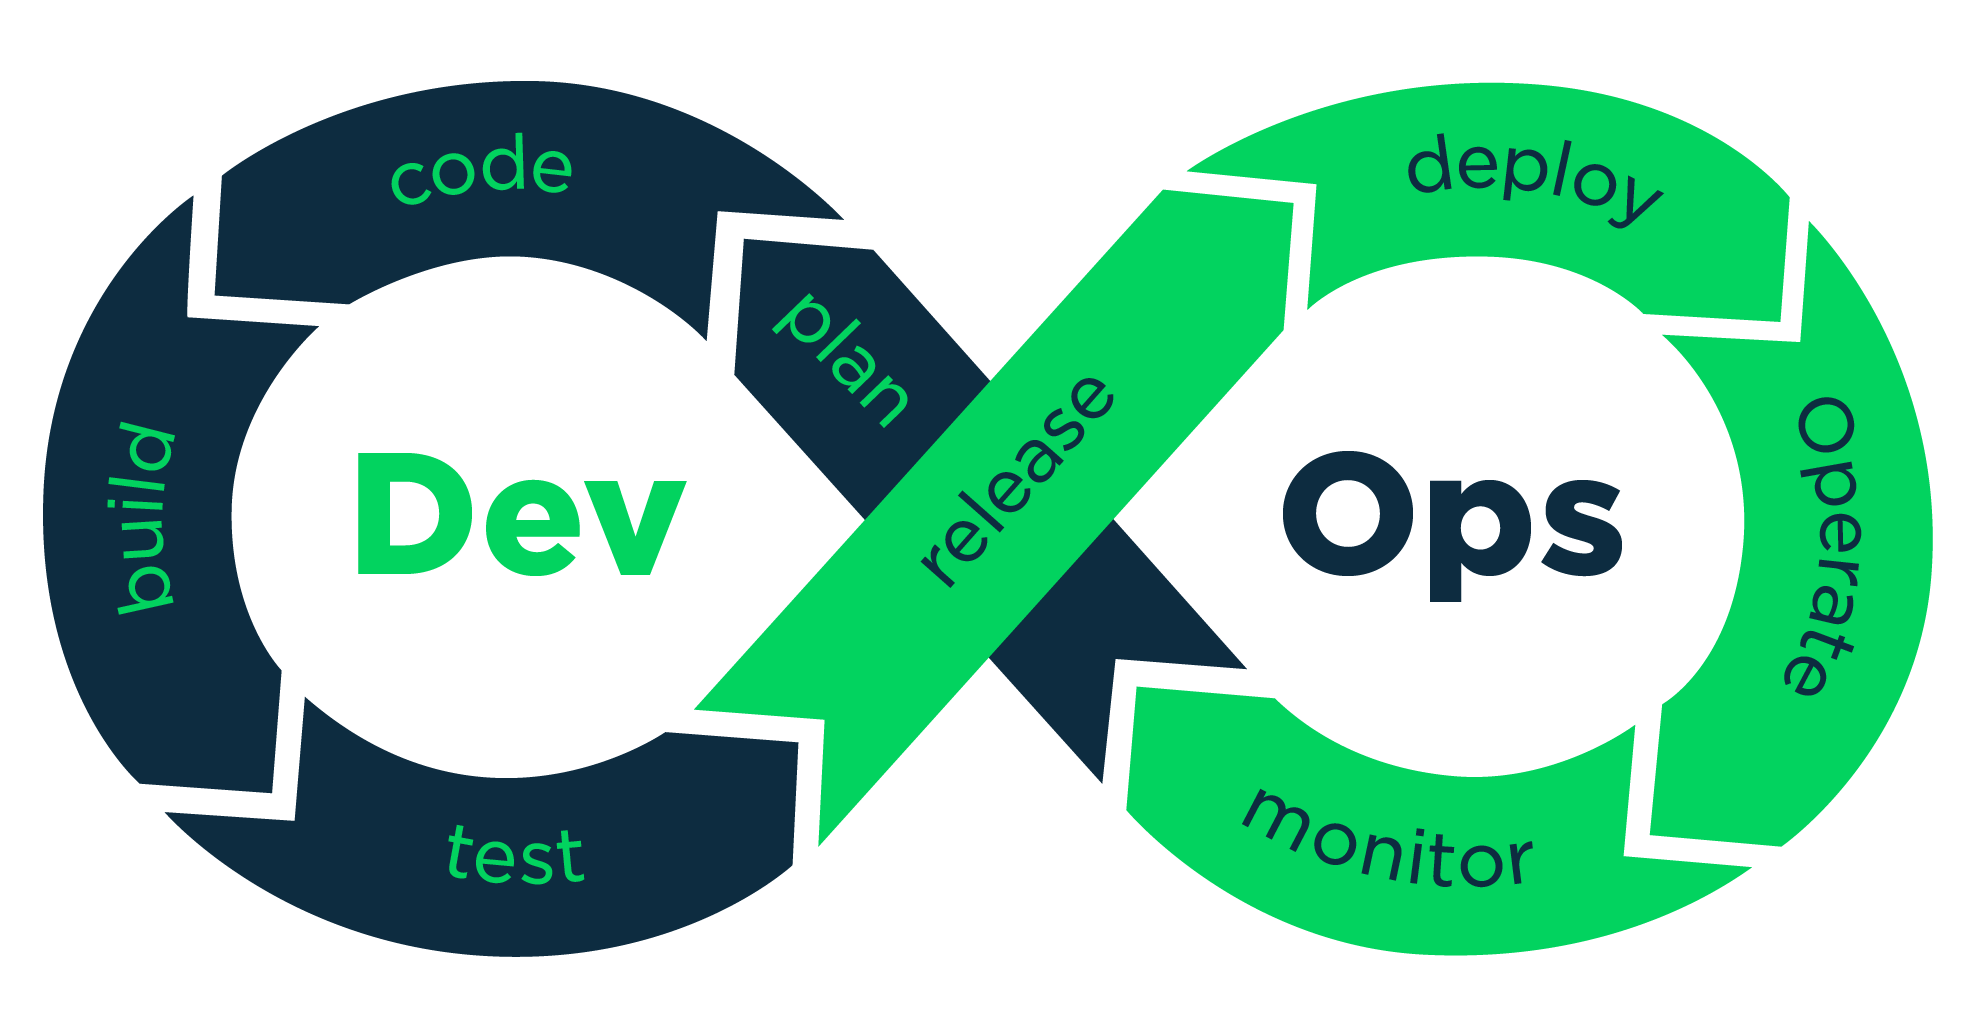
DevOps is the combination of cultural philosophies, practices, and tools that increases an organization s ability to deliver applications and services at high velocity.
Leverage IOTASCALE's skills to enhance your organizational ability to deliver high-velocity software solutions and maximize the benefits of your IT investment.


Prometheus is an open-source technology designed to provide monitoring and alerting functionality for cloud-native environments, including Kubernetes. It can collect and store metrics as time-series data, recording information with a timestamp. It can also collect and record labels, which are optional key-value pairs.
The Prometheus monitoring system includes a rich, multidimensional data model, a concise and powerful query language called PromQL, an efficient embedded time series database, and over 150 integrations with third-party systems.
To get metrics, Prometheus requires an exposed HTTP endpoint. Once an endpoint is available, Prometheus can start scraping numerical data, capture it as a time series, and store it in a local database suited to time-series data. Prometheus can also be integrated with remote storage repositories.
Prometheus features:
- Prometheus uses exporters to retrieve metrics from systems that cannot easily be scraped, such as HAProxy or Linux operating systems. Exporters are client libraries deployed on the target system, which export metrics and send them to Prometheus.
- Prometheus stores time series in memory and on local disk in an efficient custom format. Scaling is achieved by functional sharding and federation.
- Prometheus implements a highly dimensional data model. Time series are identified by a metric name and a set of key-value pairs.